
Creating charts in AI threads
Generate interactive charts in AI thread conversations by asking your agent to visualize data, then inspect values and download charts as SVG files
Visualize data directly in your conversation with an AI agent. There's no need to create a separate report.
Key benefits and use cases
-
Visualize data directly: Display data in your conversation without having to create a separate report.
-
Compare more easily: Visuals make it easier to understand categories and relationships.
-
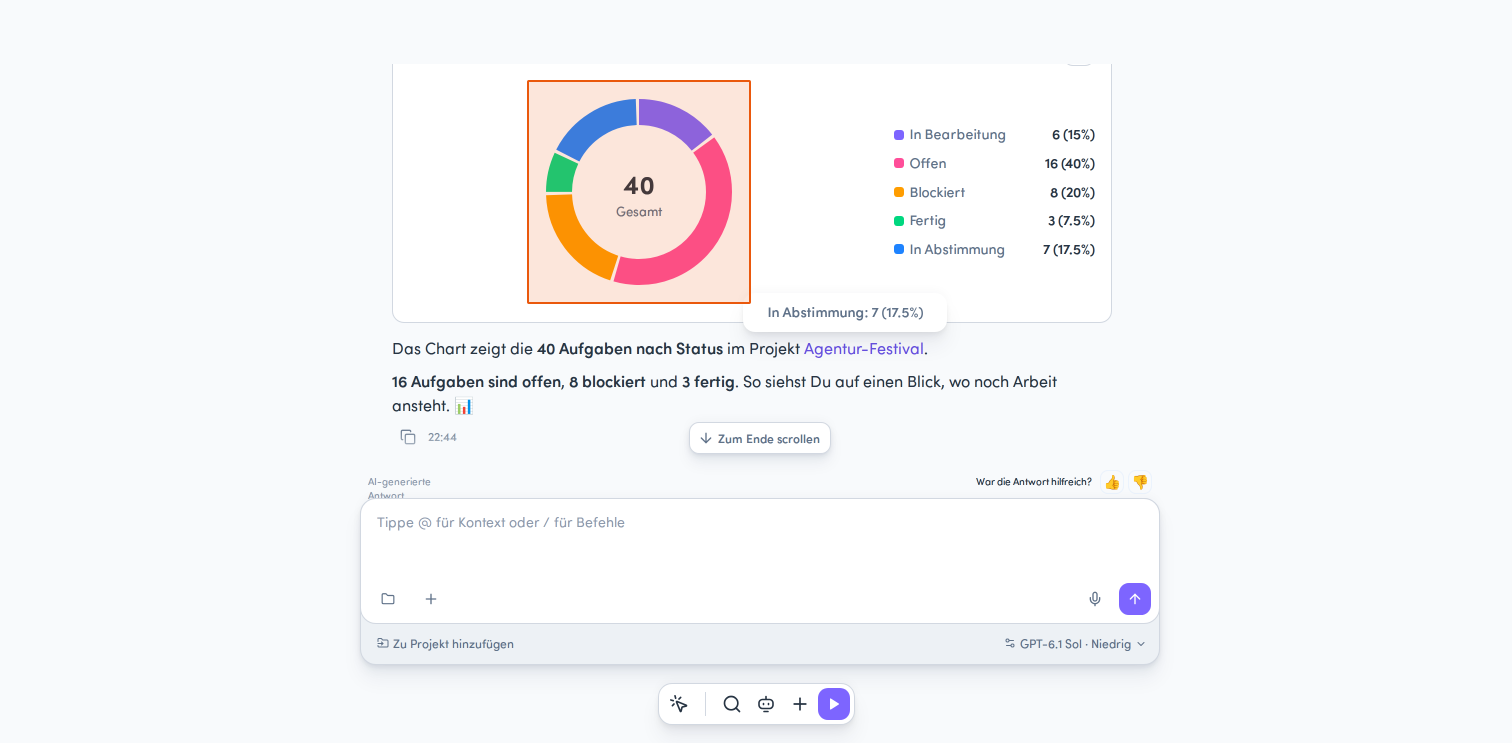
Check values directly: Unlike static images, interactive charts let you hover over bars, points, or segments to see the exact values.
-
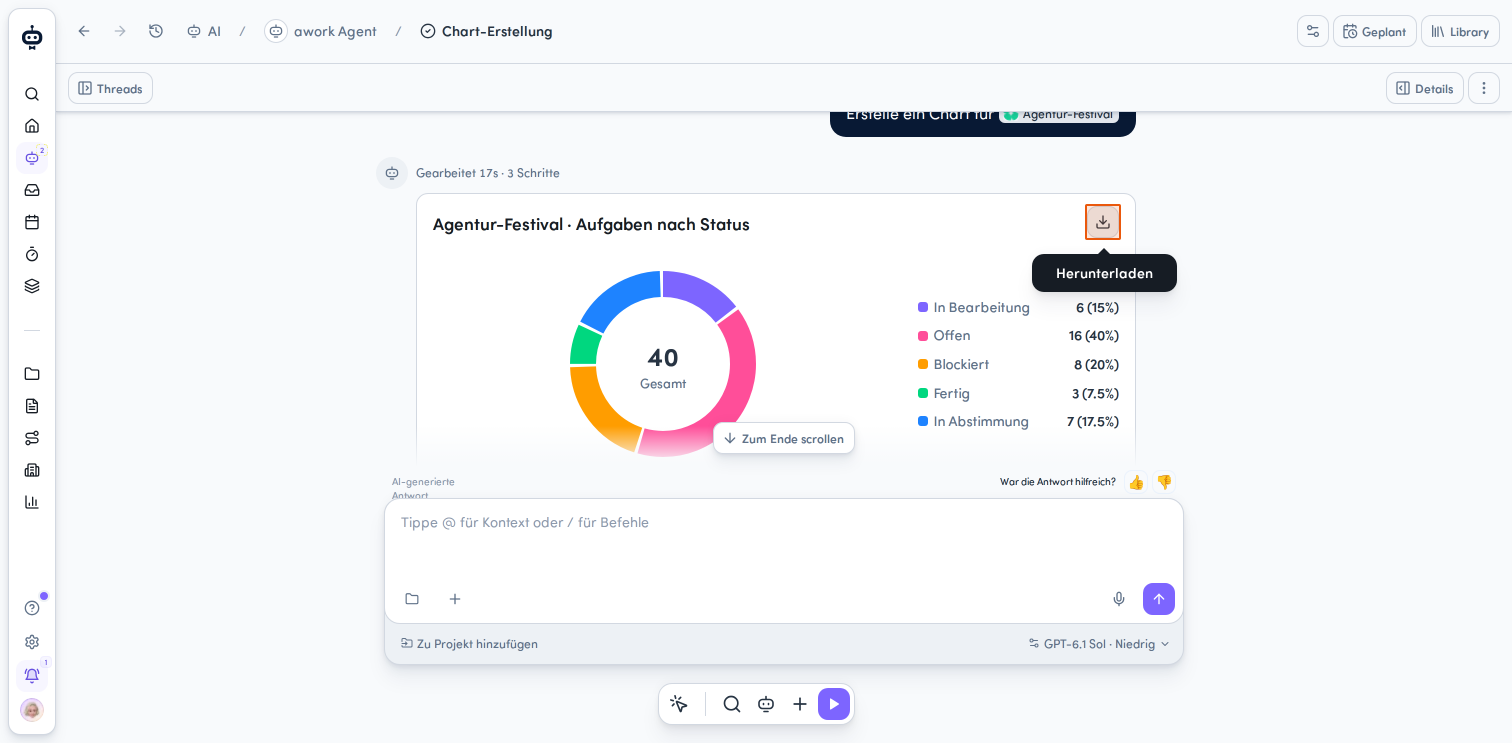
Reuse your charts: Download charts as SVG files and use them, for example, in presentations.
-
Find your results again: Charts remain available in saved conversations.
How to create charts with an agent
Requirements
Before you can create charts, make sure you meet the following requirements:
-
Your role allows you to use AI: AI & Agents verwenden (with or without sharing)
-
If you're using your own agent, you also need the Lesen und verwenden access permission
-
If you run the agent in a task or project, you need Schreibzugriff auf den jeweiligen Kontext
Create a chart
Follow these steps:
-
Open AI from the main menu.
-
Ask an agent to display data as a chart.
Once the agent has created the chart, it appears directly in the conversation.
Available chart types and features
Four chart types are supported. The type used depends on what you want to visualize.
Available chart types
| Chart type | Use |
|---|---|
| Line chart | Show trends and developments |
| Bar chart | Compare values and categories |
| Scatter plot | Visualize relationships between data points |
| Donut chart | Show parts of a whole |
Tip: Bar charts can also show grouped data series.
Explore chart segments interactively
You can inspect values directly in the chart:
-
Hover over a bar to see its value
-
Hover over a point to see its value
-
Hover over a donut segment to see its value
The legend helps you identify individual data series or segments.
Export and find your charts again
You can also use charts you've created outside of awork.
-
Export: Use the Herunterladen button in the top-right corner of the chart card to download the chart as an SVG file. The export includes the title and legend.
-
Find it again: Reopen a saved thread to view the chart you created in it.
FAQ
What types of charts can an agent create?
Line, bar, scatter, and donut charts are supported. Bar charts can also show grouped data series.
Can I download charts created by agents?
Yes. You can download charts as SVG files, including the title and legend.
Can I reopen a chart later?
Yes. Just reopen the saved thread. The chart you created in it will be available there.
Do I need an additional permission to create charts?
No. You don't need a separate permission for the chart feature. Your role must allow you to use AI. Your own agents, and using agents in tasks or projects, also require the relevant access permissions.
 Powered by happysupport.ai